Terminal-level wiring
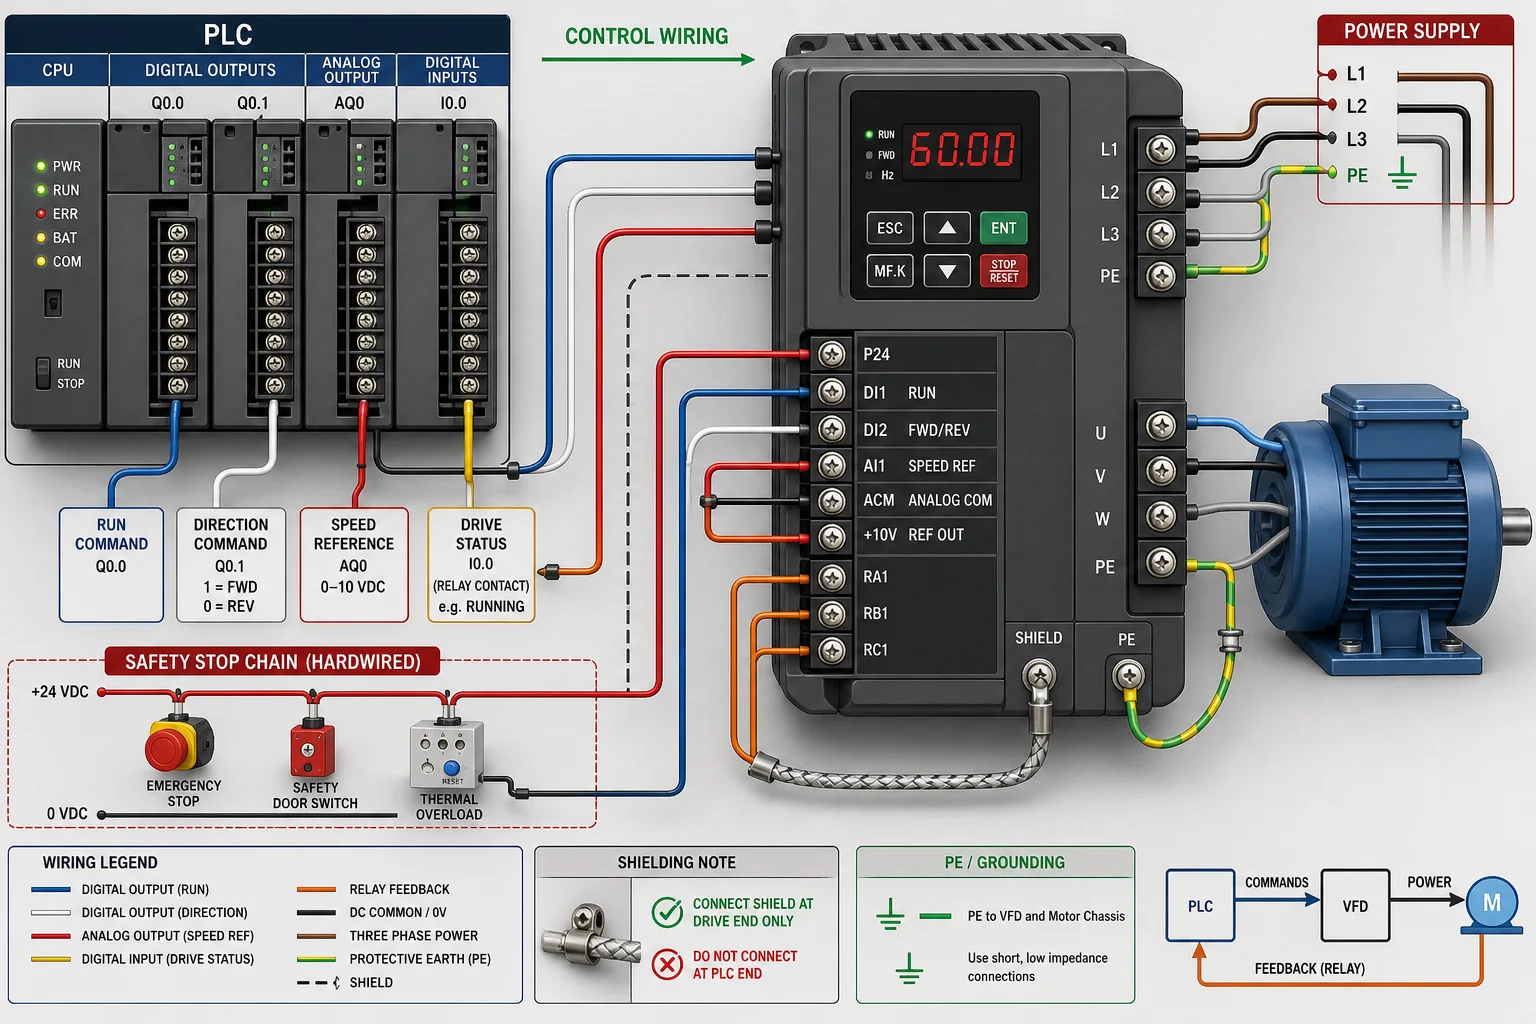
Line, PE, motor phases, dual-channel STO, hardwired run and analog reference—not a single fake “connected” toggle.
A vendor-neutral, browser-based VFD simulator for technicians and controls engineers. Wire it. Parameterize it. Prove STO. Run a real process load. Diagnose the fault from evidence.
No install · works on desktop, tablet and phone · training model, not a manufacturer configurator
Quick answer: a VFD simulator should let you commission the complete drive system—not only change frequency. This one connects terminal wiring, motor data, command and reference sources, STO, process load, live measurements, faults and a commissioning record in one browser workbench.
Use this page to understand the equipment, workflow and terminology. Sign in to the Pro path to operate the full physics model, complete commissioning evidence, inject faults and continue into a prepared PLC–HMI Sandbox project.
Local keypad & motor ID
First start
Conveyor commissioning
Foundation
Pump with 4–20 mA reference
Process control
Fieldbus fan control
Networked drive
Drive diagnosis bay
Advanced
Drive system visual guide
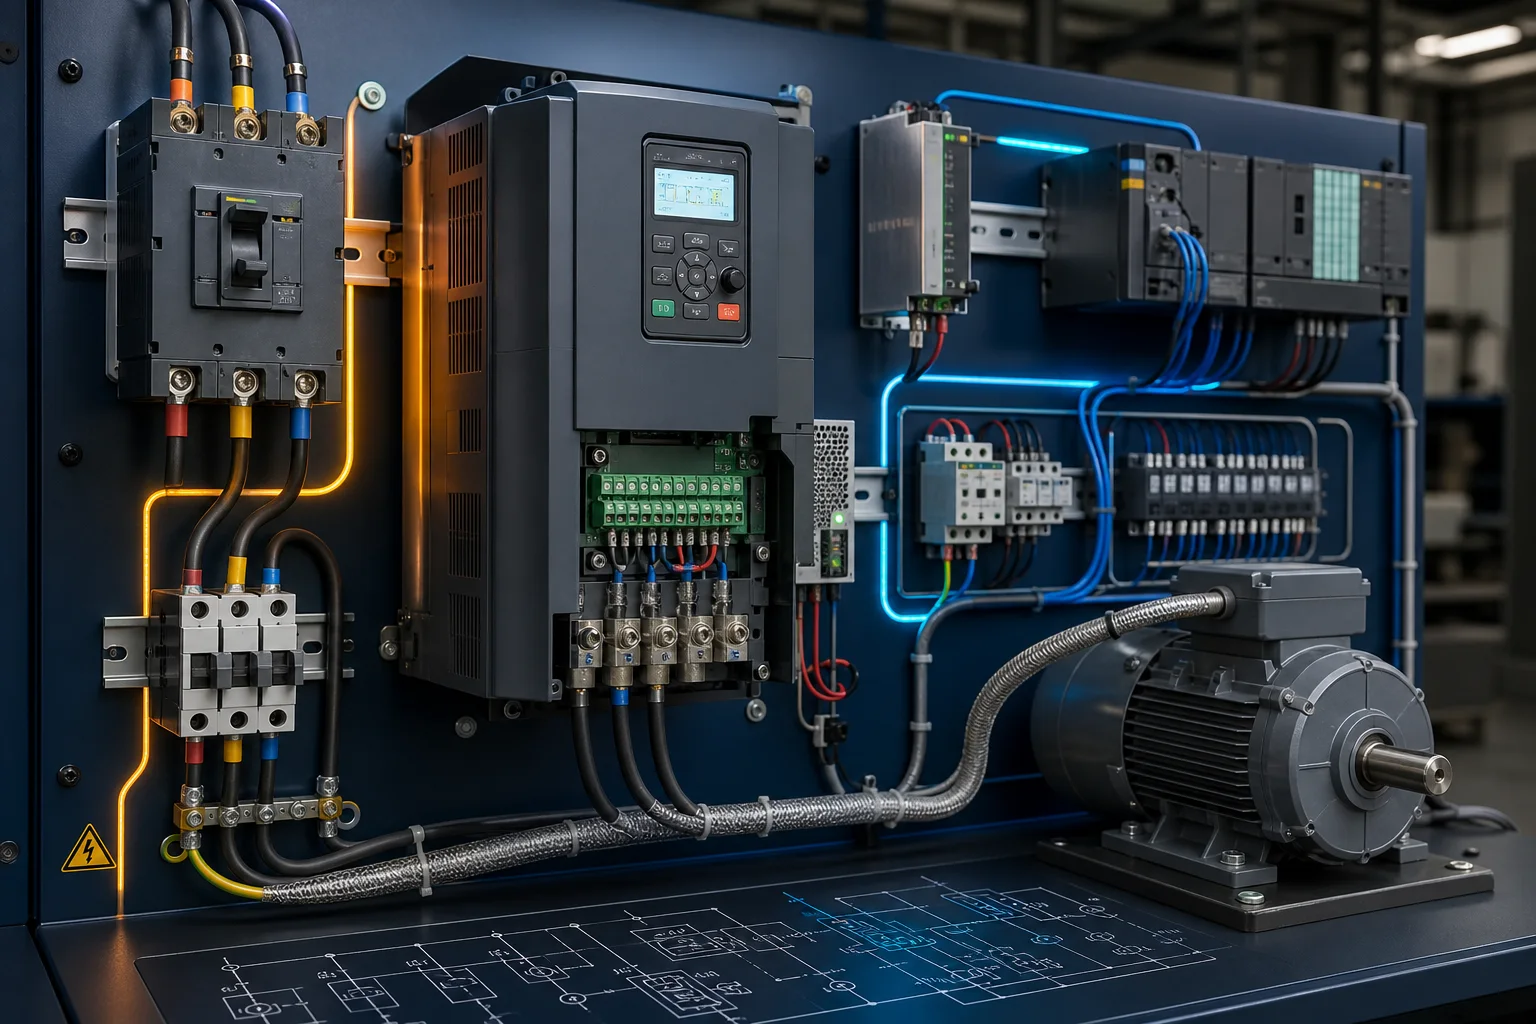
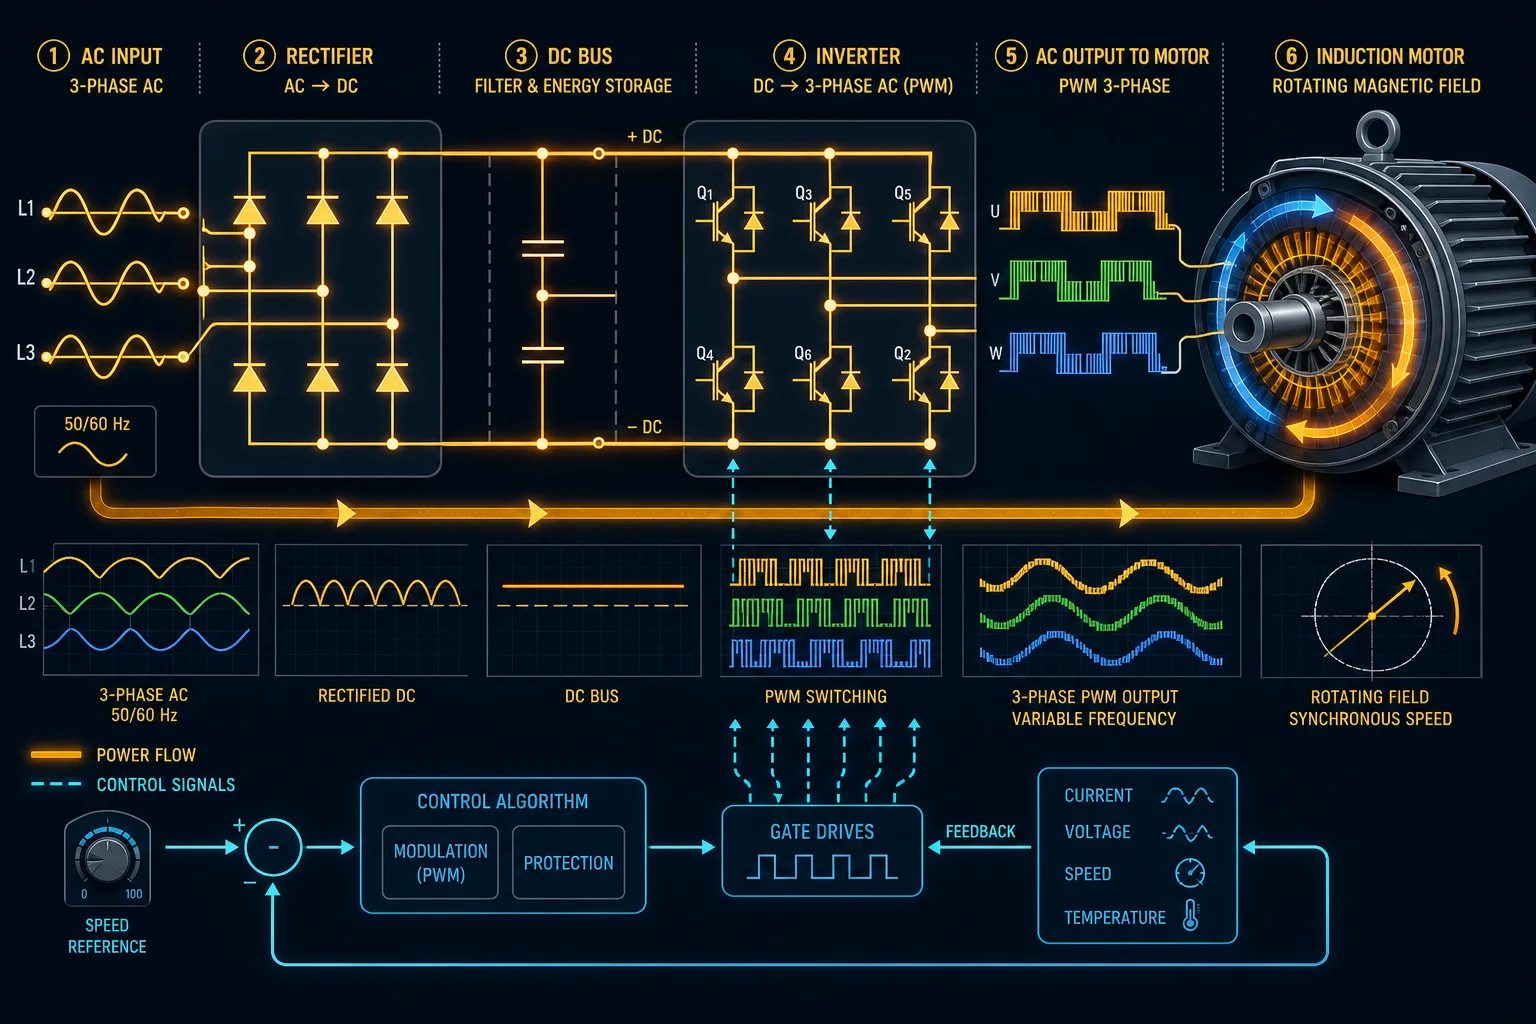
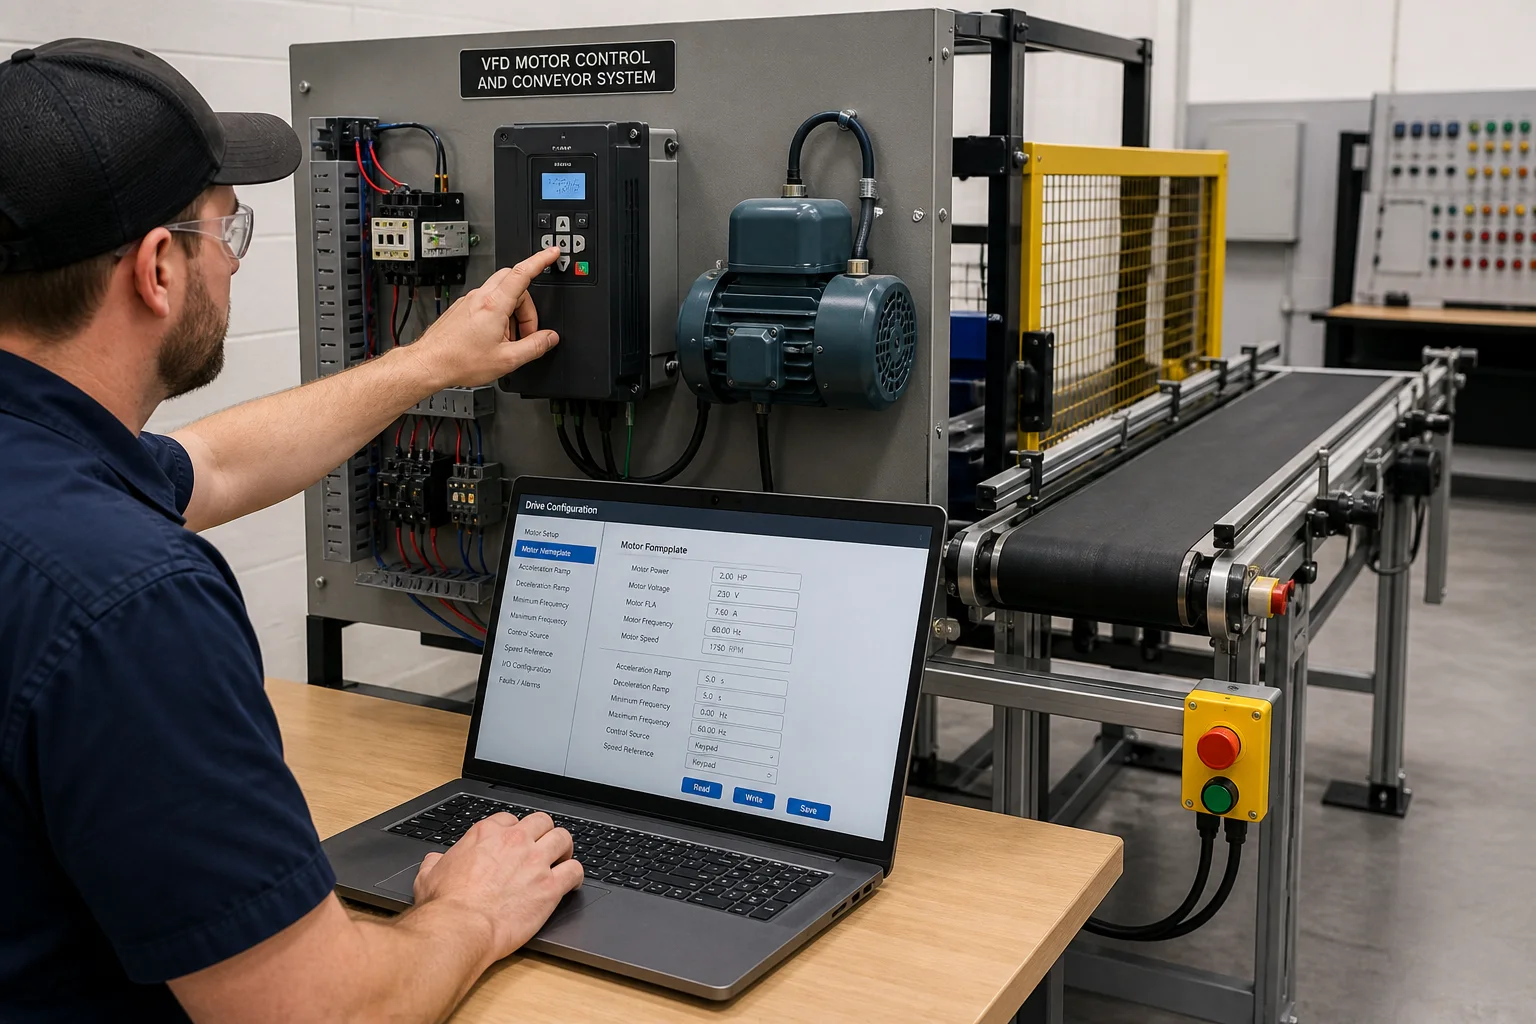
A VFD only makes sense as part of a system. Follow the energy path, control wiring, motor data, load response and diagnostic evidence before opening the interactive commissioning workbench.
Content depth
The workbench connects electrical installation, motor data, application behavior, safety proving and fault diagnosis. That is the sequence technicians face at a real drive cabinet.
Line, PE, motor phases, dual-channel STO, hardwired run and analog reference—not a single fake “connected” toggle.
Motor nameplate, stationary motor identification, min/max limits, ramps, command source and speed-reference source against a real job sheet.
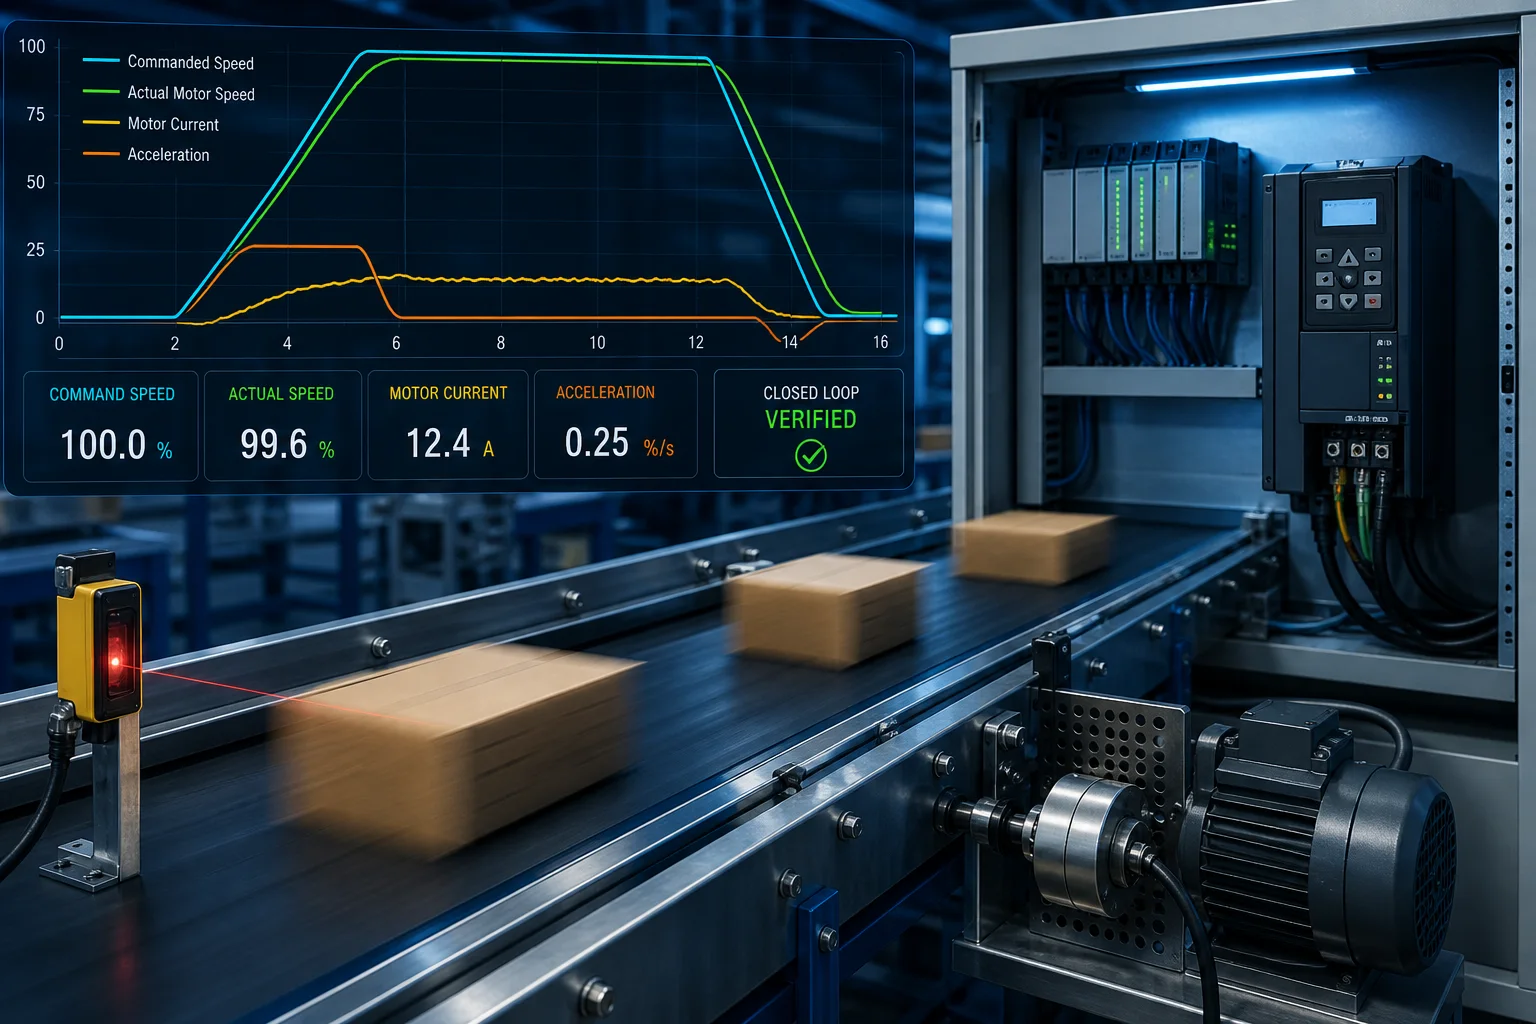
Conveyor, centrifugal pump, fan and dynamometer views respond to frequency, load, current and trips.
Compare command circuits, reference functions, stop modes, flying start, PID, current limiting and motor-control modes.
Keep terminals and codes precise in 2D, then inspect the same live motor, shaft and process response in an orbitable 3D lab.
Live current, DC bus, temperature, speed error and five-entry trip history separate electrical and mechanical causes.
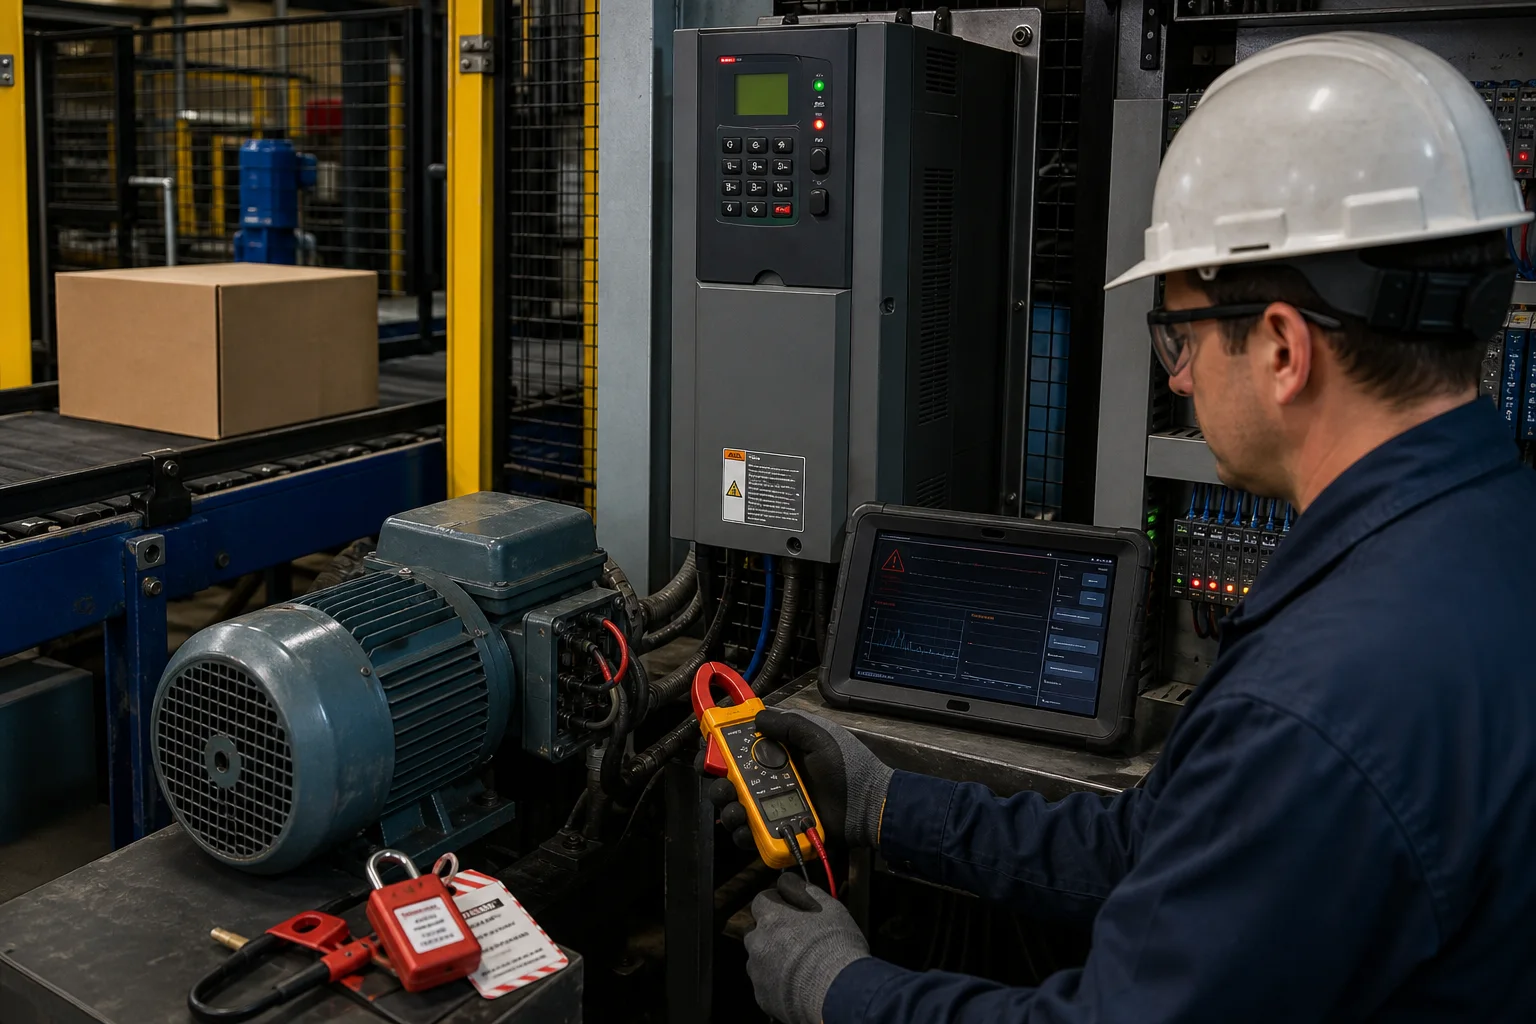
Safe isolation before wiring, both STO channels, uncoupled bump test, direction confirmation and loaded proving run.
Jammed load, phase loss, supply collapse, blocked cooling, open STO and aggressive deceleration behavior.
Shipped features · verified 9 August 2026
These are live product capabilities, not roadmap promises. 5 guided VFD/VSD commissioning jobs now share one instrumented runtime across technical 2D and interactive 3D views; the separate function explorer adds 12 standalone experiments.
Three-phase line, PE, U/V/W motor, digital, analog and dual-channel STO terminal work
Motor nameplate, stationary motor ID, operating limits, ramps, command source and speed-reference source
2-wire and 3-wire commands; keypad, terminal and fieldbus sources; jog, forward/reverse and control/status words
Analog, preset, motor-pot and PID references; skip band, current limit, V/Hz and sensorless-vector control
Ramp, coast, quick-stop and DC-brake behavior plus flying start and communication-loss response
Conveyor, centrifugal pump, fan and dynamometer machine-load models
Frequency, rpm, current, torque, DC-bus voltage, temperature and load
Seven fault conditions, five-entry trip history and cause-aware reset permissives
Step-by-step actions, reasons, expected evidence and progressive hints for every job
Isolation, STO, direction, unloaded and loaded proving checks in a commissioning record
No-install responsive browser UI, descriptive technical images and reduced-motion support
Function and code library
These are authored guides for the drive behaviors people actually search and troubleshoot. Each uses a stable vendor-neutral training code, explains the physical consequence, names the evidence to watch and deep-links to the matching function lab. Exact manufacturer parameter numbers still come from the installed drive manual.
Showing 12 of 12 authored guides.
A 2-wire VFD command follows a maintained contact: closed means run and open means stop. A 3-wire circuit uses momentary start and stop inputs; the drive latches the run request after the start pulse is released.
Explain and test →F-25Flying start—also called speed search or catch on the fly—estimates the speed and direction of an already rotating motor before the drive reapplies controlled torque.
Explain and test →D-01A VFD fault code identifies which protection function operated; it does not by itself prove the failed component. Diagnose with the code, first-changing measurement, trip history and machine condition together.
Explain and test →F-20A VFD run command can come from the local keypad, hardwired terminals or a fieldbus control word. The selected source must match the signal the PLC or operator is actually sending.
Explain and test →F-31Jog is a deliberate low-speed command that temporarily overrides the normal speed reference while the jog input or keypad command is active.
Explain and test →F-23The speed reference is the requested output frequency or process demand. It can come from the keypad, 0–10 V, 4–20 mA, preset speeds, a motorized potentiometer, PID output or a fieldbus word.
Explain and test →F-22A VFD can ramp the frequency down, remove torque and coast, use a faster quick-stop ramp, or apply DC injection braking. Each produces a different current, torque, stopping time and DC-bus response.
Explain and test →F-61–F-63Preset speeds are stored frequency references selected by digital inputs or control bits. They provide repeatable operating points without an analog signal.
Explain and test →F-71–F-72A drive PID function compares a process setpoint with transmitter feedback and continuously changes motor frequency to reduce the error.
Explain and test →F-41Current limiting caps drive output current and therefore available motor torque. The drive may slow or extend acceleration instead of immediately tripping when the load demand reaches that limit.
Explain and test →F-21V/Hz control applies a frequency-to-voltage profile and is simple and robust. Sensorless vector control uses a motor model to regulate flux and torque more accurately, especially at low speed and changing load.
Explain and test →S-01Safe torque off prevents the drive from generating motor torque when its safety channels are de-energized. It does not isolate mains power and does not necessarily stop a moving machine quickly.
Explain and test →Visual field guide
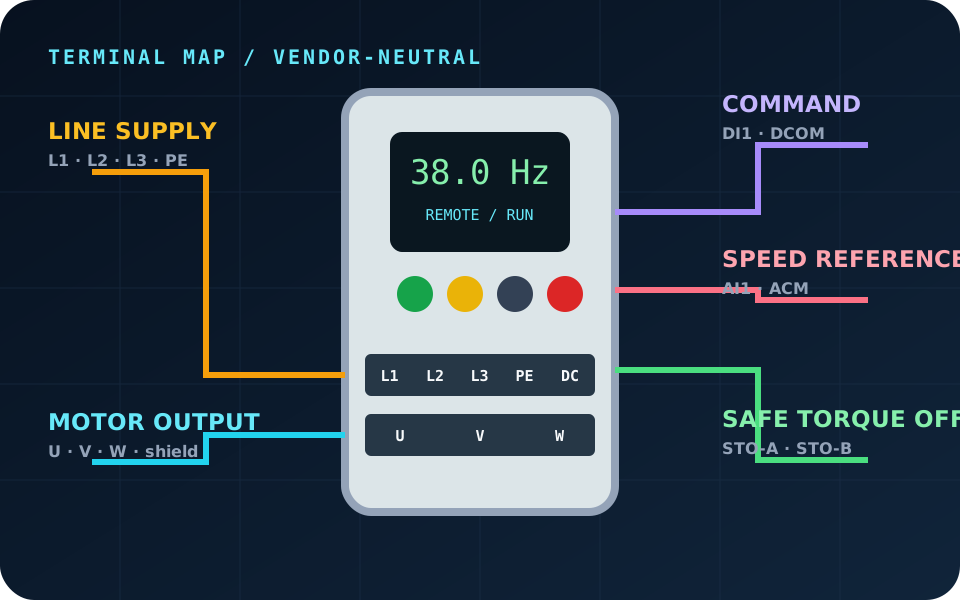
Each visual answers a commissioning question the interactive bench then lets you test. They use vendor-neutral terminal names and component relationships so the lesson transfers without pretending every drive has identical parameter numbers.
Installation
Power, motor, control, analog and safety connections have different purposes and failure symptoms. The lab keeps their terminals visible instead of reducing commissioning to one connected switch.
Workflow
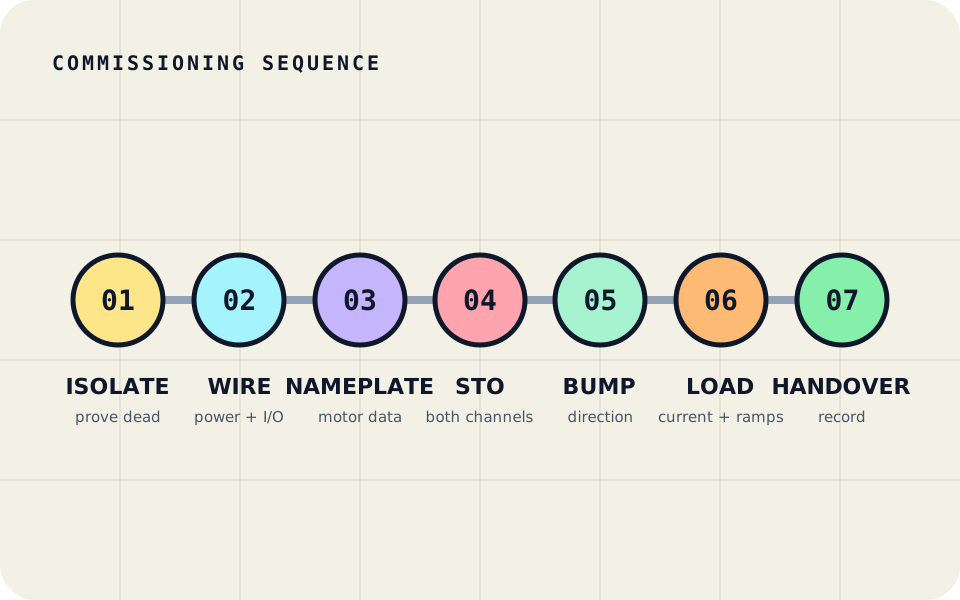
Isolation comes before terminal work; motor identification comes before running; an uncoupled direction check comes before the loaded proving run. Each completed check becomes evidence in the record.
Parameters
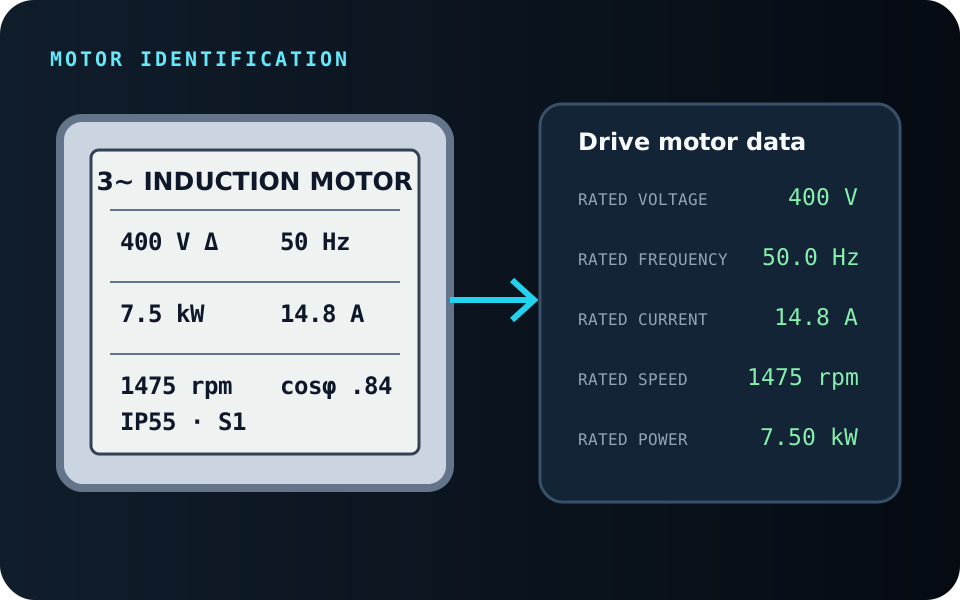
Rated voltage, frequency, current, speed and power describe the motor the drive must control and protect. Wrong data can produce poor torque, misleading load values or nuisance trips.
Functional safety
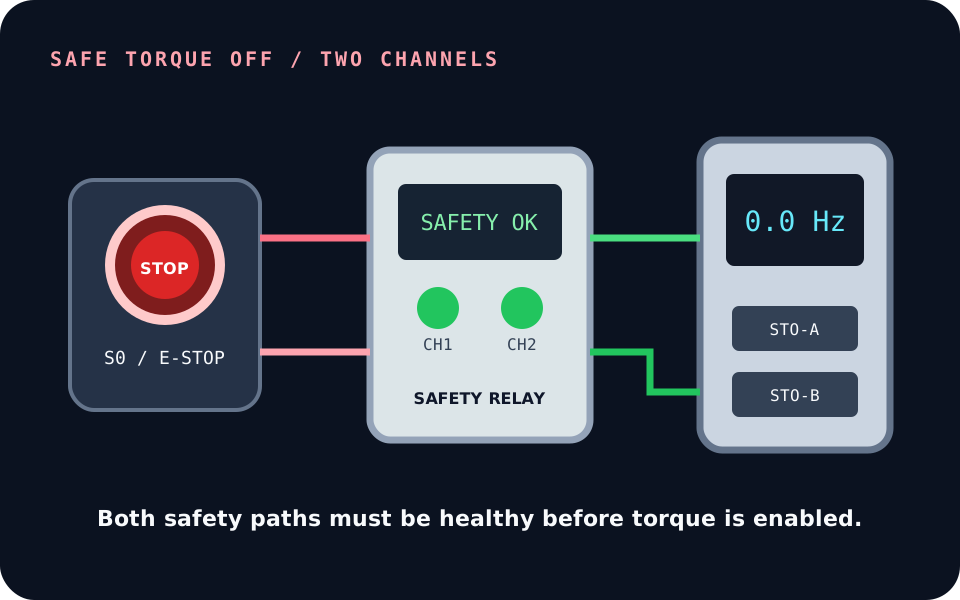
The safety relay feeds two independent drive inputs. The motor can be stopped by command while torque remains available; STO is the separate safety function that prevents torque generation.
Control I/O
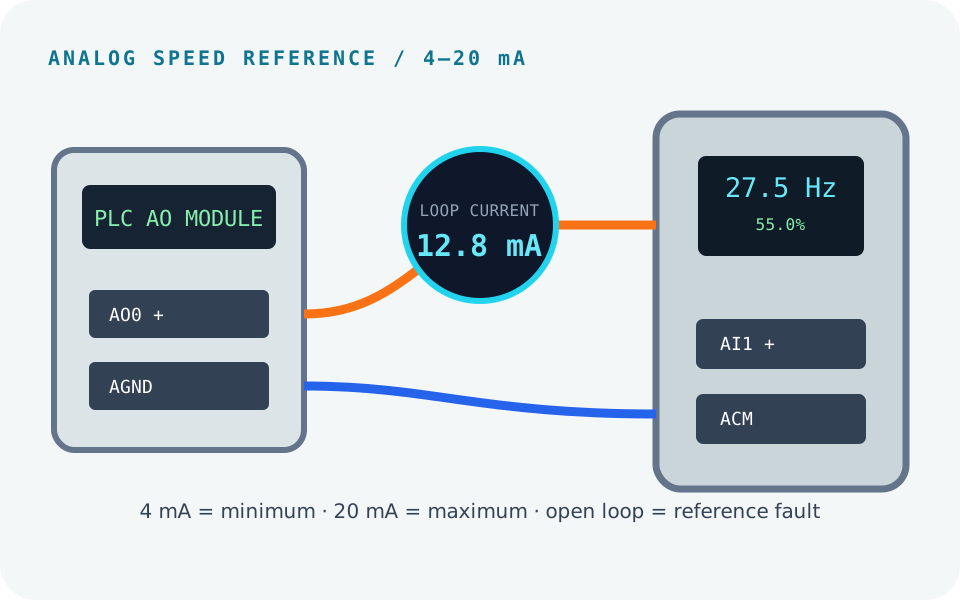
The signal must be wired to AI1 and analog common, configured for current rather than voltage, and scaled to the intended frequency range. A live loop value separates wiring faults from scaling faults.
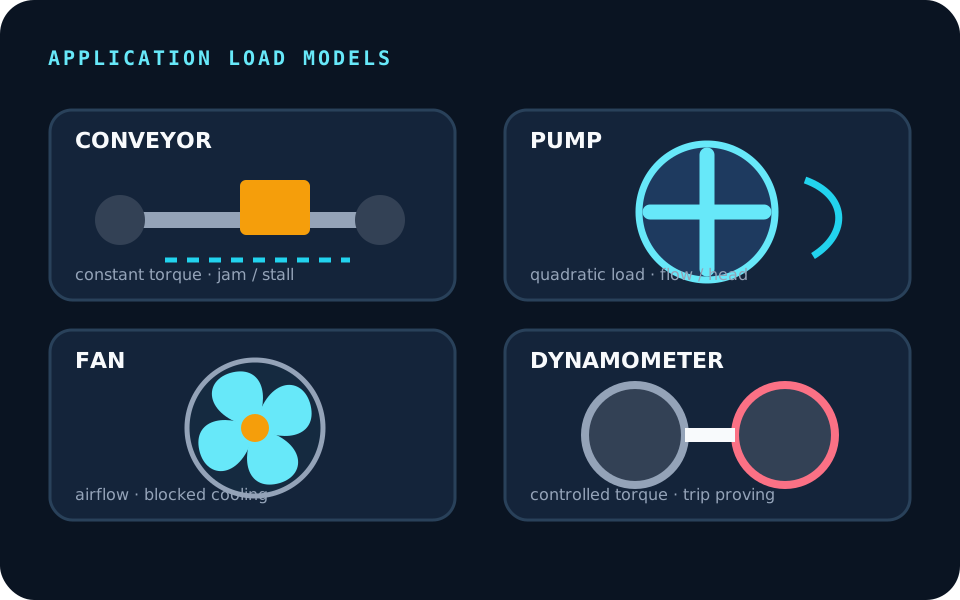
Machine physics
A loaded conveyor behaves differently from a centrifugal pump or fan. The process model changes current, torque, speed response and likely trip conditions rather than animating every motor identically.
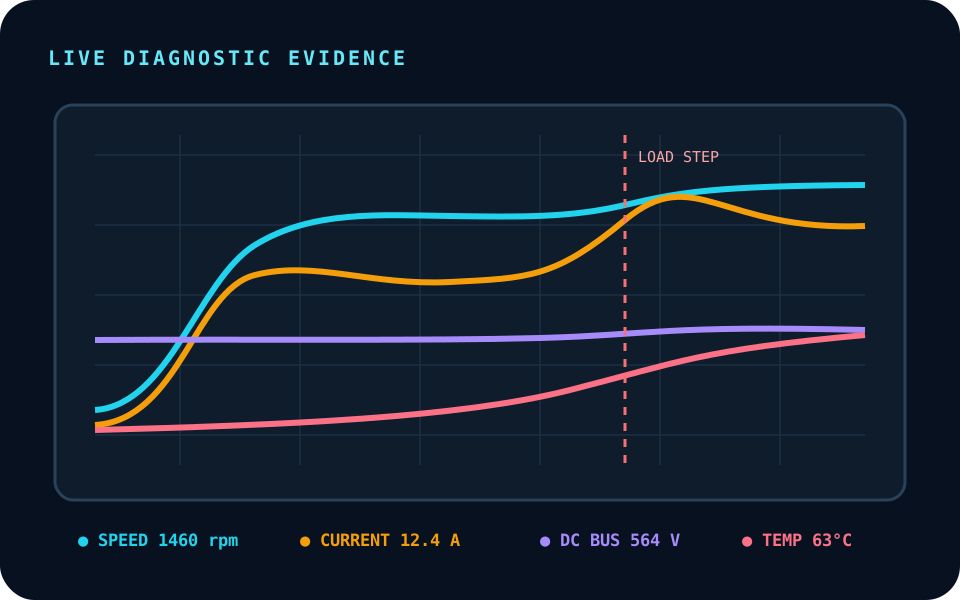
Diagnostics
Frequency, actual speed, current, DC bus and temperature create a fault signature. A load step with stable supply evidence points somewhere different from a falling DC bus or rising heat-sink temperature.
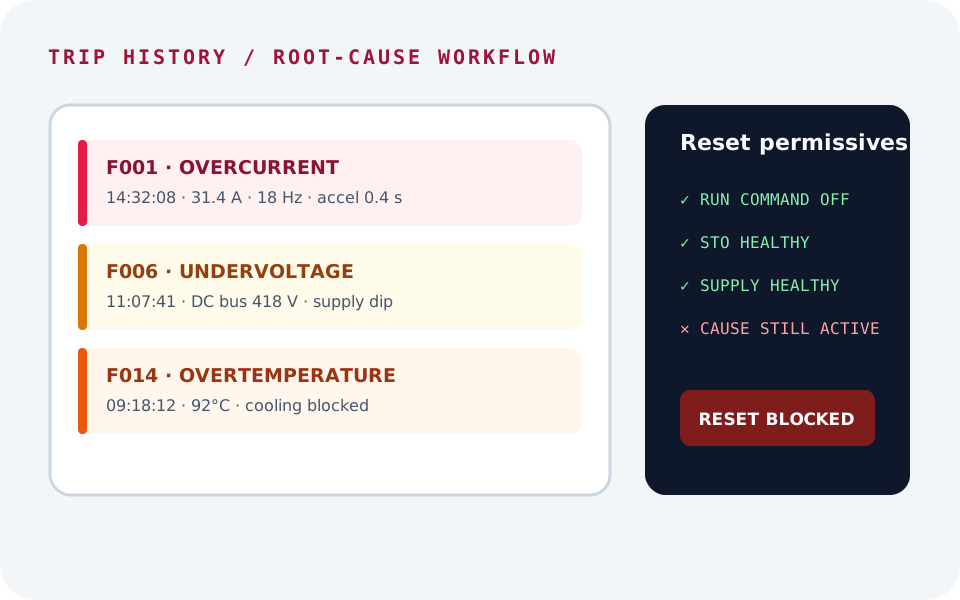
Recovery
Trip history preserves evidence after the machine stops. Reset remains blocked while the injected cause or run request is active, reinforcing recovery as a controlled commissioning step rather than a reflex.
Practical method
The sequence is deliberately conservative. It separates installation, configuration, functional proving and diagnosis so a symptom is not masked by changing several things at once.
For real equipment, the drive manual, approved schematic, motor data, machine risk assessment and site isolation procedure always take precedence.
Open the upstream isolator, prove the training circuit dead and inspect line, motor, earth, control and safety conductors before changing a connection.
Connect L1/L2/L3 and protective earth to the drive, then U/V/W and the motor protective conductor. Keep supply and motor terminals conceptually separate.
Land the digital run command and common, the analog or fieldbus reference path, and both STO channels required by the job.
Copy rated volts, hertz, current, speed and power from the nameplate. Set the application limits and ramps from the commissioning sheet.
Use keypad control for an uncoupled bump test. Confirm rotation, actual speed, current and stop response before transferring control to the PLC.
Select terminal or fieldbus command and the required reference source. Prove minimum, midpoint and maximum demand rather than checking only one value.
Couple the conveyor, pump, fan or dynamometer. Compare current, torque, speed error, DC bus and temperature with the unloaded baseline.
Diagnose the injected trip from evidence, remove the cause, satisfy reset permissives and complete the commissioning record.
Parameter guide
Manufacturers use different numbers and menu structures, but the engineering questions remain recognizable. The simulator groups them by purpose so learners understand what they are setting before memorizing a vendor menu.
| Parameter group | Typical entries | Commissioning reason |
|---|---|---|
| Motor identity | Rated volts, hertz, amps, rpm and power | Protection, slip and load calculations start with correct motor data. |
| Operating limits | Minimum, maximum and base frequency | Limits must suit the motor, machine and required process range. |
| Ramps | Acceleration and deceleration time | Aggressive acceleration raises current; aggressive deceleration can raise the DC bus. |
| Command source | Keypad, terminals or fieldbus | A healthy drive will not run if it is listening to a different command source. |
| Reference source | Keypad setpoint, AI1 or fieldbus word | The run command and speed reference can come from different places. |
| Protection | Current limit, overload and reset behavior | Protection should match the motor and application, not hide a mechanical problem. |
Demanding torque faster than the motor and drive can deliver raises current and can produce overcurrent or current-limit operation.
A high-inertia load can regenerate energy into the DC bus. The simulation exposes the resulting voltage rise and trip evidence.
Protection and load indication become unreliable when the drive is configured for a different motor than the one connected.
Local, terminals or PLC
A drive can receive its run command from a terminal while receiving speed over an analog input, or receive both over a network. When the source selection is wrong, the drive may show ready with no response—an easy condition to misdiagnose as failed hardware.
Symptom-led diagnostic
Do not start by changing random parameters. Split the system at observable boundaries—ready state, safety permit, run command, speed reference, drive output and mechanical response—so every reading either proves a stage or narrows the fault.
Read the status and active fault before changing a parameter. Confirm control power, a healthy DC bus, no active trip and no start inhibit. A blank display, faulted drive and ready drive are three different diagnoses.
Record: Display state, active fault, DC-bus value and ready bit
Prove both STO channels and any external enable or safety-relay feedback. An ordinary STOP command and safe torque off are not interchangeable: STO can leave the drive powered and communicating while torque remains disabled.
Record: STO A/B status, enable input and safety-chain indication
Compare the selected command source with the live keypad, terminal or fieldbus command. A terminal can switch correctly while the drive is still configured for keypad control; a PLC bit can be true while the control word is not owned or enabled.
Record: Selected command source and live run-command state
A valid run command with a zero, incorrectly scaled or wrong-source reference can produce a ready drive and stationary motor. Check the selected reference source, live value, engineering units, minimum frequency and direction.
Record: Selected reference, raw input and commanded hertz
If commanded frequency stays at zero, remain in command, reference and inhibit logic. If frequency rises but current and motor speed do not, inspect output wiring, isolation, motor connection and feedback. If current rises without speed, investigate the mechanical load or brake.
Record: Output hertz, motor current, actual speed and torque/load
Remove the active cause before resetting, clear the run request where required, then prove a controlled restart. Save the before-and-after evidence so a reset does not erase the only useful fault signature.
Record: Trip history, removed cause, reset permissive and proving run
The free micro-lab makes you prove both the run permission and a non-zero speed reference before the motor moves.
Troubleshooting logic
An overcurrent trip does not automatically mean a defective drive. A jammed conveyor, an unrealistically short acceleration ramp or incorrect motor data can create similar symptoms. Undervoltage begins with supply and DC-bus evidence; overtemperature begins with load, cooling and temperature history; STO status begins with the safety channels, not the ordinary run command.
The fault bay therefore exposes measurements and preserves history. The learner identifies which evidence changed first, removes the active cause, stops the command and only then resets. That sequence is transferable to manufacturer-specific diagnostics.
One model, two views
The 2D view keeps terminal marks, parameter codes, keypad values and meter readings fixed and legible on desktop and mobile. It remains the primary engineering interface for wiring and evidence.
The optional 3D lab makes the cabinet, cable route, induction motor, shaft, coupling and driven equipment spatially clear. It is not a disconnected animation: both views consume the same frequency, signed rpm, current, direction, load and trip state, with a reduced-motion fallback and automatic return to 2D if WebGL is unavailable.
Continue the signal path
Use the commissioning checklist for the complete evidence sequence, the wiring tutor for physical terminations, motor-control circuits for contactors and interlocks, and the protocol guides for command/status mapping.
Watch the real browser product respond to the task on this page, then try the same practical workflow yourself. No slides, concept mockups, install, or credit card.
Try this in the browserMotor, wiring and VFD path
Move from safe control wiring and contactors into VFD parameters, measurements, faults and PLC command paths.